Three more very questionable tropical storms were named in August. The area of convection south of Newfoundland in this water vapor image was named Tropical Storm Franklin:

It was first named a depression on the 12th at 21Z, at 36 latitude, then named a tropical storm on the 13th at 9Z, at latitude 37.9.
The small cluster of convection seen in the upper center of this visible image was named Tropical Storm Gert at 18Z on August 14th (15 minutes after the time of the image):

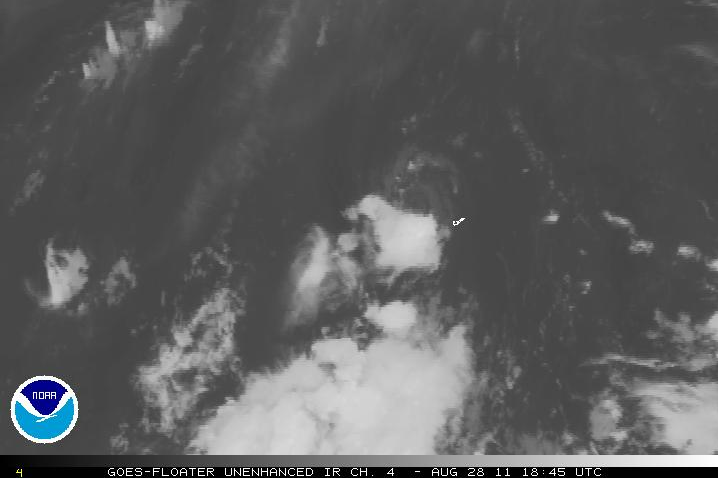
This small swirl of shallow convection just north of Bermuda was named Tropical Storm Jose on August 28th (not the large area of deep convection to the south):

Since it is almost impossible to see, here is a closer view:

An image from 7 hours earlier (18:45Z) shows a very small area of deeper convection, and this was only 6 hours after it was first named at 12Z.

This tropical wave near the Lesser Antilles on August 20th was what later became Hurricane Irene just a few hours before it was declared a tropical storm:

Hurricane Irene moving past Hispaniola on the 22nd:

Moving through the Bahamas on the night of the 23rd:

Near peak strength as a category 3 on the 25th:

As Irene approaches North Carolina on the 26th, there does appear to be some dry air entrainment:

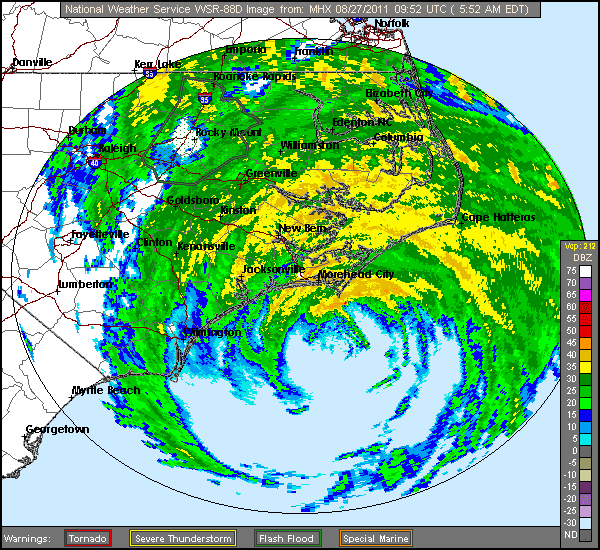
Radar imagery from North Carolina on the morning of the 27th shows a loosely organized eye:


On the evening of the 27th, after crossing North Carolina, Irene moved out into the Atlantic again:

Irene was dumping heavy rain over a huge portion of the East Coast:

Many people have said that the intensity of Hurricane Irene was exaggerated after the first landfall.
Buoy 44009, 26 nautical miles southeast of Cape May, NJ reported winds at 45 mph with gusts to 63 at 5:50 PM EDT on August 27th. Winds at 40 mph with gusts to 54 were reported as late as 11:50 AM EDT on the 28th.
Buoy 44014, 64 nautical miles east of Virginia Beach reported winds at 47 mph with gusts to 65 at 6:50 PM EDT. Winds at 45 mph with gusts to 54 was reported as late as 3:50 AM EDT on the 28th. According to Hurricane Irene
discussion number 31, issued at 11 PM EDT on August 27th by the National Hurricane Center, a reconnaissance flight reported 700 mb flight-level winds of 92 knots, and the stepped frequency microwave radiometer (SFMR) estimated 66 knot winds in a small area over 100 nautical miles east of the center of Irene. The buoy measurements were taken and the discussion was issued when Irene was over open waters between the Outer Banks of North Carolina and the Delmarva Peninsula.
Discussion 32, issued at 5 AM EDT, August 28 noted a gradual weakening of Irene, but also that the minimum pressure was still 958 mb, and that hurricane force winds from aloft may be brought down to the surface in the convective environment. Discussion 32 was issued while Irene was near the New Jersey Coast, and the last to keep Irene at hurricane strength.
On August 15th, Auckland, New Zealand was hit with
record cold and the
heaviest snow in 50 years.

 Same storm two days later:
 This is category 4 Typhoon Roke on September 20th south of Japan with 115 knot (135 mph) winds:
 It was a category 2/90 knot (105 mph) storm when it made landfall in southern Japan around 4:30Z on the 21st.


 Tokyo was hit with 90 mph winds and 260,000 households lost power.
 Yesterday (September 29th), this 992 mb storm prompted storm warnings for Lake Superior and Lake Michigan:
 Winds gusted to 60 mph at Sturgeon Bay Airport, 69 at Stannard Rock Lighthouse (Lake Superior), 69 at Sister Bay (Door County, WI), and 71 at Green Bay Lighthouse. At 3:50 AM toady, Buoy 45007 in south central Lake Michigan, 43 miles ESE of Milwaukee, reported 23 foot waves.


