An overview of how I do forecasting before a storm chase.
A Source of Lift
Usually, thunderstorms won't initiate without some type of lift. Lift is usually produced by jet stream dynamics, surface boundaries, and sometimes topography (orographic lift). When the flow aloft is diffluent, it tends to produce lift underneath it. Frontal boundaries, drylines and outflow boundaries are sources of lift as airmasses with different densities converge. Lift can also be produced by upslope flow.
Convective Available Potential Energy (CAPE)
A measure of instability. When air near the Earth's surface is lifted, it expands and cools. Eventually condensation can occur, which releases latent heat and further increases buoyancy. This is what drives thunderstorm development. CAPE measures how much buoyancy is available. Usually I'm looking for CAPE of least 1,000 J/KG.
Convective Inhibition (CINH)
Convective Inhibition measures how much warm air aloft is inhibiting thunderstorm initiation (negative buoyancy). Usually this needs to be less than 50 J/KG to allow thunderstorms to initiate, but it varies depending on the strength of the lifting.
Deep Layer Shear
In order to sustain thunderstorm updrafts, precipitation needs to moved away from the updraft by sufficient vertical wind shear (change in wind speed or direction with height). Usually I look at the effective bulk wind difference (EBWD). It should be 25 knots at a minimum, and preferably higher than 40 knots.
Low Level Shear
Shear in the lowest 1 KM is important for tornado formation. 0-1 KM storm relative helicity (SRH) should be at least 100 M2/S2, and preferably higher then 200 M2/S2.
Veering With Height
Discrete supercells are the most favorable storm mode for tornadoes. Supercells are more favored when the wind veers with height (turns clockwise). Ideally, winds at the surface will be from the east, and as you go up from the south, then from the west.
Lifted Condensation Level (LCL)
The lifted condensation level determines the height of the cloud base. When rain falls below the cloud base, evaporative cooling occurs. If the cloud base is too high, storms tend to produce too much cold outflow for tornadoes to form. Generally, I want LCL heights to be below 1.5 KM.
Storm Motion Vectors
Discrete supercells are most likely when the storm motion takes it away from the boundary that initiated the convection. If storms are moving parallel to a boundary, they tend to merge into a line. If storm motion is perpendicular to the boundary, supercells will be favored. Storms should also be moving faster than the boundary or they may be forced into a line or even be undercut by the boundary. For storm chasing purposes, a storm motion to the east if preferred because it is more aligned with the road network. Slower moving storms are also preferred. It can be difficult to keep up with a storm moving to the northeast at 40+ mph if the roads are all east-west and north-south.
Mar 13, 2022
Tornado Forecasting


Aug 30, 2019
Huricane Dorian likely to hit Florida
The HMON, HWRF, GFS, GDPS, ECMWF, GEFS, CMCE and EPS all indicate Hurricane Dorian will landfall somewhere in central or southern Florida. Landfall is most likely Monday night of Tuesday morning (Sept 2nd or 3rd). Dorian may slow as it approaches Florida, which could prolong the impact of wind and storm surge, and increase the risk of flooding. Though it's still early, the models are now generally putting Dorian's track near West Palm Beach or Port St. Lucie.
Dorain is currently a category 2 hurricane with wind estimated at 105 mph. Dorian will be entering an area with light shear and water temperatures in the mid 80s. This should allow Dorian to strengthen to category 4.
Dorain is currently a category 2 hurricane with wind estimated at 105 mph. Dorian will be entering an area with light shear and water temperatures in the mid 80s. This should allow Dorian to strengthen to category 4.
Apr 17, 2018
April Snowstorm
A very late season snowstorm produced up to 33" of snow in central Wisconsin from April 13-15.
 Some snow totals:
14.3" Sioux Falls, SD
15.8" Minneapolis - St Paul
24.2" Green Bay, WI
21.2" Appleton, WI
28.0" Stevens Point, WI
31.6" Carlsville, WI (Door County)
33.0" Amherst, WI (Portage County)
At Green Bay, the 24.2" that they received was the largest April snowstorm on record. The previous record was only 11.0" on April 4 - 5 in 1977. Incredibly, it was the 2nd largest snowstorm on record. The largest had been 29.0" on March 1 -2 1888. There have been numerous roof collapses in the Green Bay Area. Green Bay has had 36.7" of snow in just April alone. The previous snowiest April was just 15.1" in 1907.
The first half of April has been up to 16F below normal for the Midwest:
 NWS Des Moines reports that temperatures for the April 1 - 15 period have been 11.5 - 16.0F below normal, and the coldest since 1881:

14.3" Sioux Falls, SD
15.8" Minneapolis - St Paul
24.2" Green Bay, WI
21.2" Appleton, WI
28.0" Stevens Point, WI
31.6" Carlsville, WI (Door County)
33.0" Amherst, WI (Portage County)
At Green Bay, the 24.2" that they received was the largest April snowstorm on record. The previous record was only 11.0" on April 4 - 5 in 1977. Incredibly, it was the 2nd largest snowstorm on record. The largest had been 29.0" on March 1 -2 1888. There have been numerous roof collapses in the Green Bay Area. Green Bay has had 36.7" of snow in just April alone. The previous snowiest April was just 15.1" in 1907.
The first half of April has been up to 16F below normal for the Midwest:

Estherville, Mason City, Waterloo, Ottumwa and Lamoni currently
rank as the coldest start to April on record /April 1-15/. Des
Moines is currently 2nd coldest, behind 1881, as it is the only of
the sites with records dating back that far.
Jan 12, 2018
First Week of January
The first week of January was more than 20F below normal from Illinois to West Virginia.


May 3, 2017
Full Unedited Video of Greensburg Tornado
Tomorrow is the ten year anniversary of the F5 Greensburg tornado. On the night of May 4, 2007 a tornado grew to a width of 1.7 miles and destroyed most of Greensburg, KS, where 11 people were killed. It was the first F5 in 8 years.
May 2, 2017
Texas Snow and Tornadoes


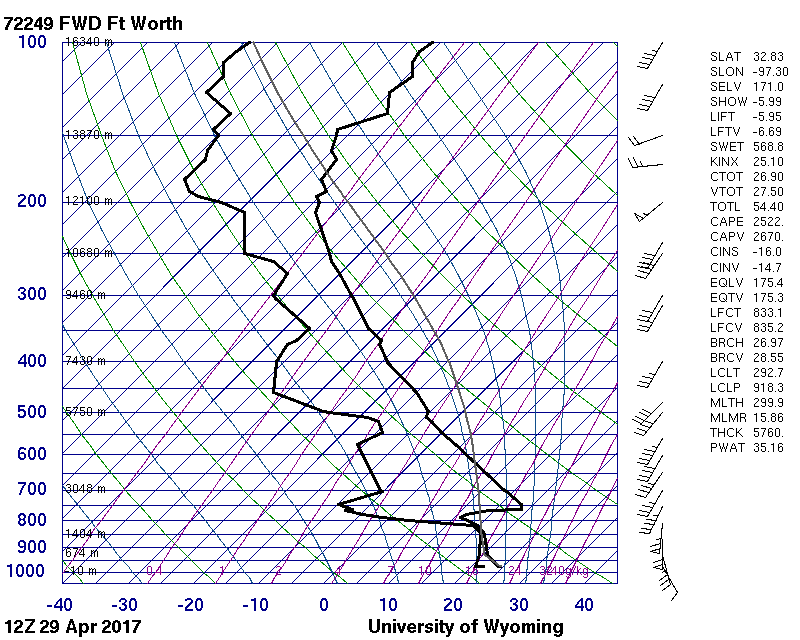
The April 29th 12Z (7 AM CDT) sounding for Fort Worth showed that there was already 2,500 CAPE:


Garden City, KS had blizzard conditions on the 30th and 11" of snow, causing three structures to collapse. 14" fell in the southwest corner of Kansas at Elkhart. One farmer near Sublette estimated that he had lost 80% of his crop. At Wallace in northwest Kansas, 28" of snow fell, with drifts of 8-10 feet. 33" fell at Lander, WY and 39" fell at San Isabel, CO.
Flooding has killed 7 in Arkansas and 3 in Missouri. In southern Missouri, the town of Houston received 11.15" of rain.
Apr 20, 2017
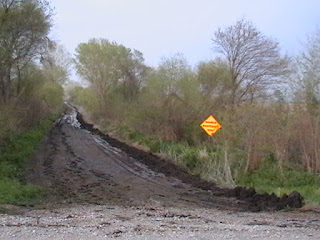
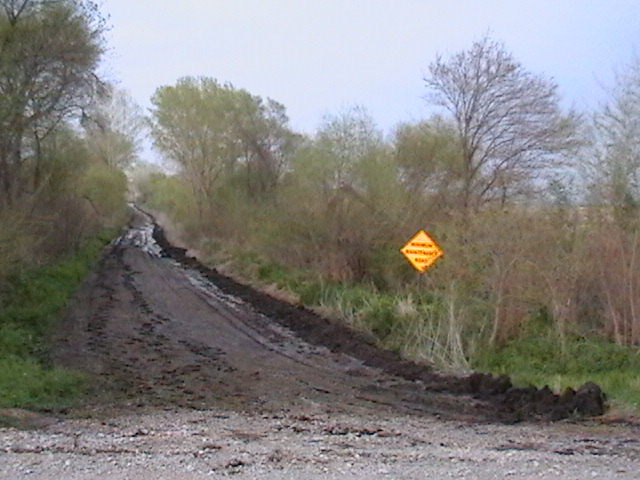
Minimum Maintenance Road
Yesterday when we were storm chasing in southeastern Nebraska, we came across a "minimum maintenance road". We decided to take a different route.
Mar 14, 2017
Chicago's Winter
It's been a weird winter for Chicago. December had 17.7" of snow - all of which fell before the 18th. The 19th had low temperature of -13. But the day after Christmas had a high 54. Only 0.6" of snow fell in January. February had just a trace. The normal for January and February combined is 19.9". In mid-February, there were six days in a row with a high temp in the 66 - 70 range. Now on March 14th, Chicago just received 7.5" of snow. December had 9.5" above normal snowfall, January was 10.2" below normal, February was 9.1" below normal, and March will be 2.2" above normal even if there isn't any more snow for the rest of the month.
Oct 1, 2016
Hurricane Matthew

Matthew is the first category 5 hurricane in the Atlantic in over 9 years. The last category 5 was Hurricane Felix in September of 2007. Felix made landfall in Nicaragua. The US hasn't been hit by a major hurricane since Wilma in 2005.
Matthew is located south of Haiti and moving westward. It will soon begin curving to the north as it moves toward an upper trough. Matthew will likely pass near Jamaica, and cross Cuba and move into the Bahamas. It's too early to tell if Matthew poses a threat to the US East Coast. It may depend in part on the behavior of a larger trough currently over the West Coast.
Jun 28, 2016
Big Tornado Season Next Year?
The number of tornadoes in the US has been below normal for the last 5 years:
 El Nino is gone. Over the last two months, sea surface temperatures have been below normal in the central equatorial Pacific. Trade winds have been above normal across most of the Pacific for the last week. It is likely that La Nina will emerge sometime later this year.
4 out of the last 5 years with tornado counts being more than 1 standard deviation above normal have been during or immediately following a transition from El Nino to La Nina (1998, 1999, 2008, 2011):

 Three of these years (1999, 2008, 2011) had well above the normal number of strong tornadoes.


4 out of the last 5 years with tornado counts being more than 1 standard deviation above normal have been during or immediately following a transition from El Nino to La Nina (1998, 1999, 2008, 2011):


Jan 25, 2016
East Coast Blizzard


Some snowfall totals:
Bowling Green, KY: 11"
Glengary, WV 1 ese: 42"
Dulles Airport, VA: 28.3"
BWI airport, MD: 29.2"
Rehouse, MD: 38"
Dover, DE 5.1 wsw: 18.2"
Philadelphia, PA: 22.4"
Atlantic City, NJ: 13.4"
Newark Airport, NJ: 28.1"
JFK Airport, NY: 30.5"
Nantucket, MA: 11.5"
The 29.2" for Baltimore is their largest on record. Winds gusted to 75 mph at Dewey Beach, DE and Langley AFB, VA. This storm caused 250,000 power outages, and over 12,000 flights were canceled.
Major coastal flooding occurred in New Jersey:
Jason Pellegrini shot this video of flooding in Sea Isle City, #NewJersey, on Saturday. #Snowzilla #blizzard https://t.co/f0cpQHz7DL— Josh Berlinger (@j_berlingerCNN) January 24, 2016
Dec 29, 2015
Central US Winter Storm


In Missouri, flooding closed parts of I-70 and I-44. 12.25" of rain fell at Union, MO, causing record flooding. At Springfield, MO the 6.03" that fell on December 26th was the second highest 24 hour total on record. The storm total there was exactly 10.00". At least 13 flood related fatalities occurred across Missouri.
On December 26th, tornadoes killed 11 in Texas. 8 of the fatalities were from an EF-4 that hit Garland, TX:
Oct 23, 2015
Hurricane Patricia Landfall

Update: NHC has indicated that at the time of landfall minimum pressure was 920 mb, and wind was 165 mph.
Hurricane Patricia

Hurricane Patricia should make landfall near Puerto Vallarta tonight. In addition to catastrophic storm surge and wind damage, flash flooding and mudslides will be a major problem, because Patricia will be moving directly into mountainous terrain.
Oct 3, 2015
Hurricane Joaquin Strengthens

At 12:00 PM EDT, data from a Hurricane Hunter plane prompted the NHC to increase the intensity of Joaquin to 135 knots (155 mph), and drop the minimum central pressure to 933 mb. Joaquin is expected to miss the US, but there is still some chance for it to pass close to Nova Scotia. Joaquin is moving north into areas with increasing shear and should not strengthen any further.
As tropical moisture, some of which is associated with Joaquin, has been forced into a front along the East Coast, over 14" was reported near Wilmington, NC over the last 2 days.
Oct 1, 2015
Hurricane Joaquin


Depth of the 26C isotherm

Aug 29, 2015
Pacific Hurricanes

Aug 15, 2015
Strong El Nino 2015


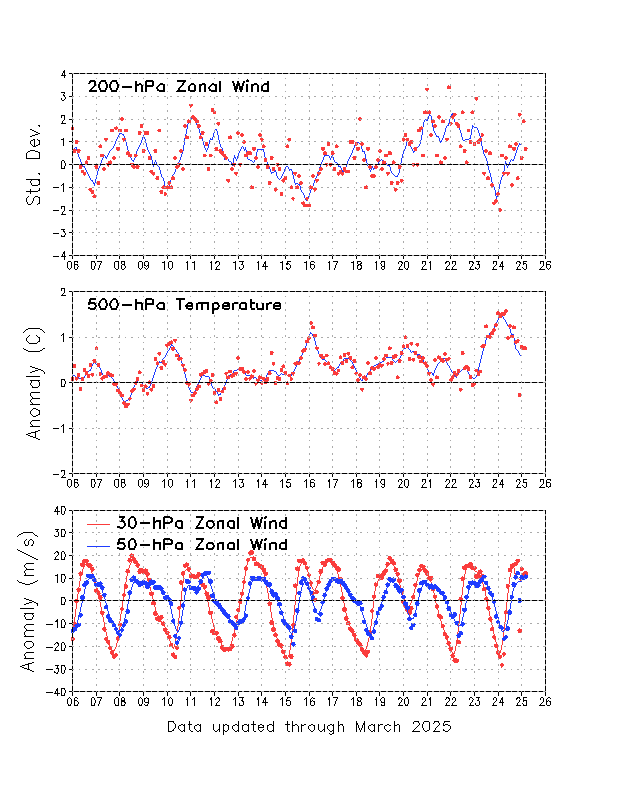
Theodor Landscheidt believed that ENSO events are correlated to solar subcycles which have enhanced x-ray flare activity. The Southern Oscillation Index (SOI) was used, because it changes before temperatures do. Significantly anomalous values in the SOI go back to August of 2014. It was only in July 2015 that the SOI indicated a strong El Nino, but trade winds were weaker than normal (westerly anomalies, shown in red below) for many months before that:


Jul 14, 2015
Boone County Supercell July 13
Yesterday, this storm in Boone County, IL damaged trees and power lines, and produced golf ball size hail near Poplar Grove, IL:


 There was also a weaker cell to its south:


And this one to its southwest:

 We were driving north on I-39 just north of US 34 at the beginning of the video below. At that time the storm was probably 50 miles away. The video runs from 8:46 - 9:12 PM CDT as we go through LaSalle, Lee and Ogle counties.
Here is the storm from up close. We are driving east on 173 between I-39 and 76 from 9:37-9:41 PM CDT.


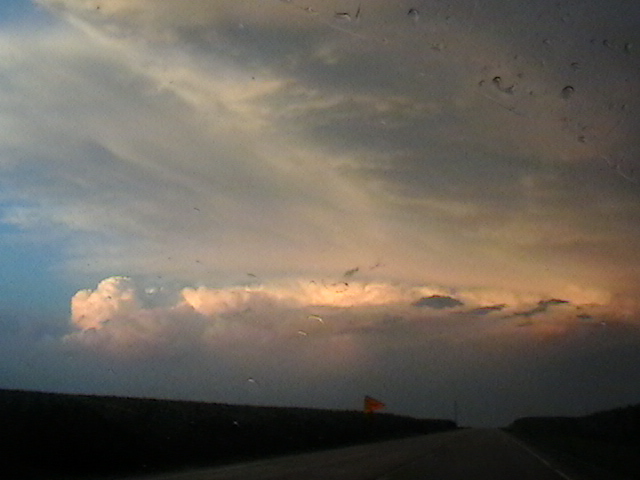
And this one to its southwest:


Jun 21, 2015
June 20 2015 Storm Chase
Yesterday (June 20th), we were storm chasing eastern in Iowa. We saw a very well defined shelf cloud associated with a severe squall line which had horizontal rotation at Wayland, IA. This was from 7:00-7:05 PM CDT:
6 minutes later, and a little east of Wayland on highway 78:
A view from directly underneath the shelf cloud at the junction of 78 and US 218 at 7:14 PM:
While we were on our way home after the storm chase, we encountered a spectacular sunset near Muscatine, IA. We were able to see lightning from the storm to our east, a rainbow, crepuscular rays, and even anti-crepuscular rays. This was from 8:19-8:34 PM CDT.
6 minutes later, and a little east of Wayland on highway 78:
While we were on our way home after the storm chase, we encountered a spectacular sunset near Muscatine, IA. We were able to see lightning from the storm to our east, a rainbow, crepuscular rays, and even anti-crepuscular rays. This was from 8:19-8:34 PM CDT.
Subscribe to:
Posts (Atom)