 I had a very successful storm chase on June 20th in Nebraska east of Grand Island. Here is what we saw.
A brief touchdown seen looking west from the Hamilton/York County line 1 mile west of Henderson at the intersection of County Road A and County Road 6 at 5:22 PM CDT. Debris is faintly visible on the ground. The funnel was visible from 5:20-5:25 PM.

At 2242Z (5:42 PM CDT) a second, much longer track tornado touched down and was seen from the intersection of Hampton Spur and County Road 11 looking east. It was observed continuously until it became obscured by precipitation at 5:55 PM. It was seen again from 5:58-6:01. It was rated an EF-2.
Tornado at 5:43 PM:
 5:44 PM:
 5:45 PM:
 5:47 PM from 3 miles southeast of Hampton while driving east of Hampton Spur on County Road 11:
 5:49 PM from 3 miles southeast of Hampton while driving north of County Road 11 on County Road Y looking northeast:
 5:51 PM from 2 miles east of Hampton while driving north of County Road 11 on County Road Y looking east:
 5:58 PM from 1 mile west of Bradshaw looking north from US 34 between County Roads C and D.
 6:00 PM from 1 mile northwest of Bradshaw while driving north on County Road D about 1 mile north of US 34.
 Video of the Hampton tornado:
At 6:20 PM we see damage southwest of Stromsburg from somewhere on Road 123 looking north.
 At 6:21 PM the tornado is spotted to the north. This was a third tornado which was rated EF-3.
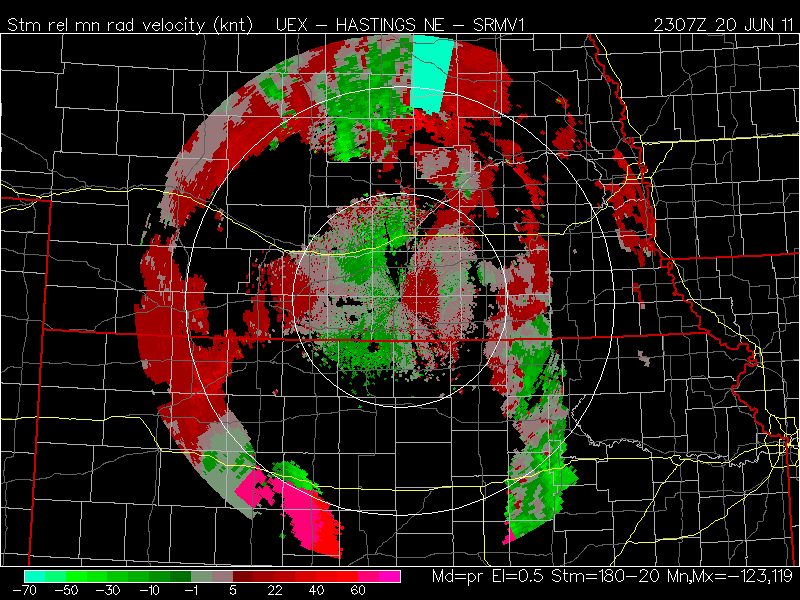
The radar imagery from 2244Z to 2317Z (5:44-6:17 PM CDT) shows the large cell which produced all three tornadoes just north of I-80:


 These tornadoes developed in an area with 6,000+ CAPE/-11 lifted index:
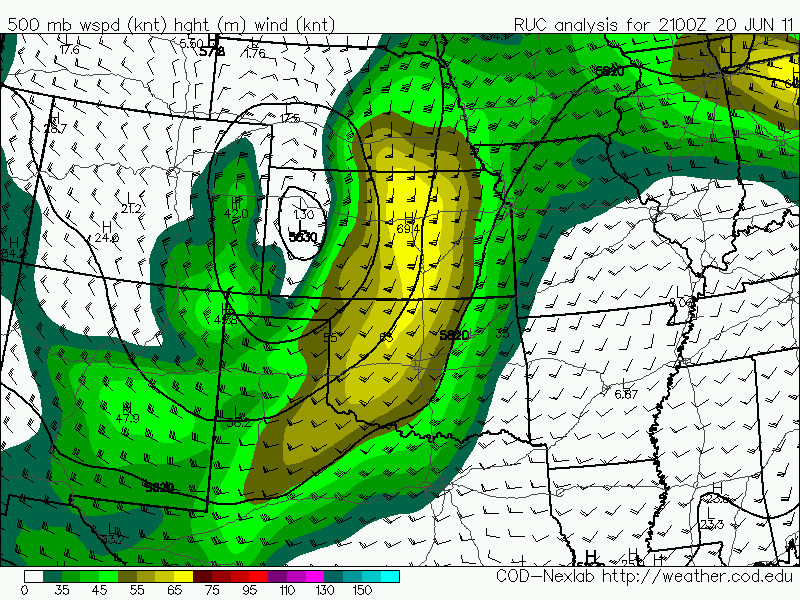
 This was underneath a left exit region of a 65 knot mid level jet:
 A 989 mb low produced east to southeast surface winds across southeastern Nebraska.
 0-1 km helicity increased rapidly in the vicinity of this supercell in the late afternoon due to a strengthening and veering low level jet, from 100 M2/S2 at 21Z (4 PM CDT) to 300 M2/S2 by 0Z (7 PM CDT):


 By 138Z (8:38PM CDT) the thunderstorms had merged into a smooth continuous arc from South Dakota to Oklahoma.
 Much more on this event here.


